1. Low level of national & per ca-pita income
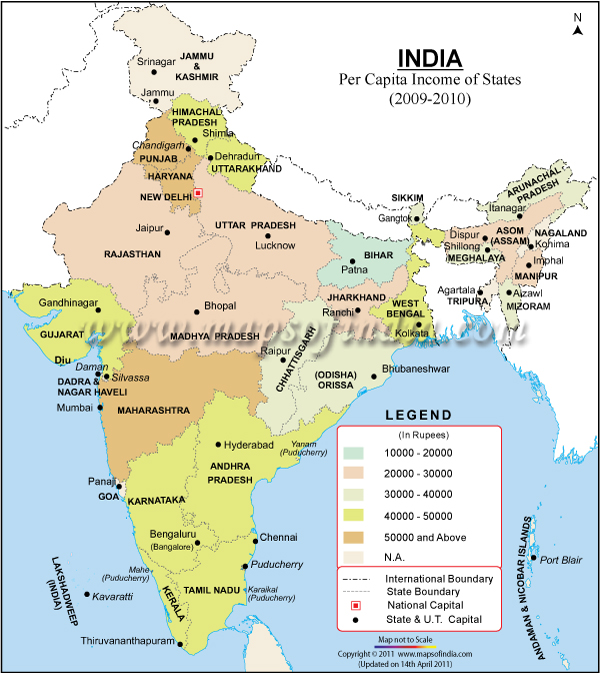
India's per capita income (nominal) was $1,570 in 2013, ranked at 112th out of 164 countries by the World Bank while its per capita income on purchasing power parity (PPP) basis was US$5,350, and ranked 106th. Other estimates for per capita Gross National Income and Gross Domestic Product vary by source. For example, India's average GDP per capita on PPP basis in 2009, according to The Economist, was US$5,138, with significant variation among its states and union territories. Go had the highest per capita PPP GDP at US$4903, while Bihar the lowest with per capita PPP GDP of US$682 as of 2015 In rupee terms, India's Per capita income grew by 10.4% to reach Rs.74,920 in 2013-14.
While India's per capita incomes were low, the average household size and consequent household incomes were higher. India had a total of 247 million households in 2011, with an average of about 4.9 people per household, according to Census of India.
Estimates for average household income and the size of India's middle income households vary by source. Using World Bank's definition of middle income families to be those with per capita income between $10 to $50 per day, the National Council of Applied Economic Research of India completed a survey and concluded there were 153 million people who belonged to middle income group in 2006. In contrast, Meyer and Birdsall and Tim Light used a different survey and estimated the number of Middle Income population to be about 70 million in 2009-2010.These groups as well as the World Bank estimated in their 2011 reports that if India's economy continues to grow per projections, India's middle income group would double by 2015 over 2010 levels, and grow by an additional 500 million people by 2025. This would make it, with China, the world's largest middle income market.
2. Vast inequalities in income and wealth:
India is suddenly in the news for all the wrong reasons. It is now hitting the headlines as one of the most unequal countries in the world, whether one measures inequality on the basis of income or wealth.So how unequal is India? As the economist Branko Milanovic says: “The question is simple, the answer is not.” Based on the new India Human Development Survey (IHDS), which provides data on income inequality for the first time, India scores a level of income equality lower than Russia, the United States, China and Brazil, and more egalitarian than only South Africa. According to a report by the Johannesburg-based company New World Wealth, India is the second-most unequal country globally, with millionaires controlling 54% of its wealth. With a total individual wealth of $5,600 billion, it’s among the 10 richest countries in the world – and yet the average Indian is relatively poor.Compare this with Japan, the most equal country in the world, where according to the report millionaires control only 22% of total wealth.In India, the richest 1% own 53% of the country’s wealth, according to the latest data from Credit Suisse. The richest 5% own 68.6%, while the top 10% have 76.3%. At the other end of the pyramid, the poorer half jostles for a mere 4.1% of national wealth.What’s more, things are getting better for the rich. The Credit Suisse data shows that India’s richest 1% owned just 36.8% of the country’s wealth in 2000, while the share of the top 10% was 65.9%. Since then they have steadily increased their share of the pie. The share of the top 1% now exceeds 50%.This is far ahead of the United States, where the richest 1% own 37.3% of total wealth. But India’s finest still have a long way to go before they match Russia, where the top 1% own a stupendous 70.3% of the country’s wealth.
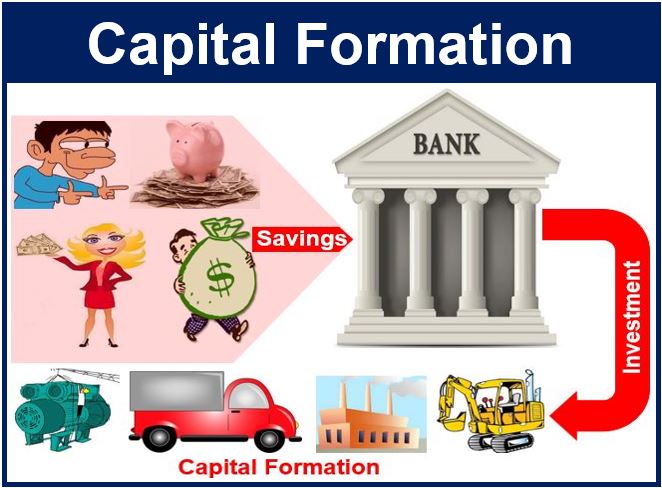
3. Scarcity of capital and low rate of capital formation:
Reasons
a. Low Level of National Income and Per Capita Income
b.
Lack in Supply of Capital
c. Lack in Supply of Capital
d. Small Size of Markete. Lack of Skilled Entrepreneursf. Immobility of Savingsg. Backwardness of Technologyh. Demonstration Effecti. Lack of Effective Fiscal Policy
j. Lack of Investment Incentives
4. Underdeveloped infrastructure
 Being an LDC, India’s infrastructural facilities or economic and social overheads of capital are inadequate. It consists of (a) transport and communications, (b) energy, (c) finance, housing and insurance, (d) science and technology, and (e) health, education, etc.Availability of these infrastructures creates the conditions for favourable growth. The superstructure of an economy largely depends on the availability of infrastructural facilities.As far as social and economic overheads are concerned, India is poor. It is indeed true that her railway and road networks are comparable to the developed nations. But her demand for infrastructural facilities and services outpace their supplies. Per capita energy use (oil equivalent) of an Indian in 2004 was 531 kg vis-a-vis USA’s 7,921 kg. Even China’s per capita energy use was higher (1,242 kg.) than India’s.Compared to other countries, India is poor in information technology. In 2005, the use of personal computers per 1,000 Indians was as low as 16 as against 762 per 1,000 US people. India’s health expenditure as a percentage of GDP was 1.39 p.c. in 2007-8 over the USA’s 15 p.c. of GDP.
No comments:
Post a Comment